Soon after the release of the “nation’s report card” Tuesday, education advocacy groups unleashed their differing interpretations of the results, along with their often contradictory prescriptions for fixing schools.
They couldn’t agree whether the 2017 scores on the biennial National Assessment of Educational Progress were bad or good — they were “flat” and “stagnating,” “mixed” and “steady” or even contained “bright spots.” They all cited the results as evidence that change was needed; they just couldn’t agree on what kind of change. One group wanted better “screening” for teachers, another more private school options. Several said schools needed stronger accountability, which usually means testing, but an anti-testing group said nearly two-decades of high-stakes tests had produced little progress.
But a Georgia State University doctoral student who knows his way around statistical software pointed, convincingly, to what he sees as the obvious lousy test score culprit: poverty.
Jarod Apperson, a Ph.D. candidate in economics who teaches at Spelman College knows about education. He's done research with a Georgia State University professor about the damage done by the cheating scandal in Atlanta Public Schools. He served on the board of Kindezi, a charter school group hired by Atlanta to turn around some of the city's lowest-performing schools. And he consulted with private schools and organizations on everything from the state's school funding formula to charter school lotteries that give poor kids a leg up on admission.
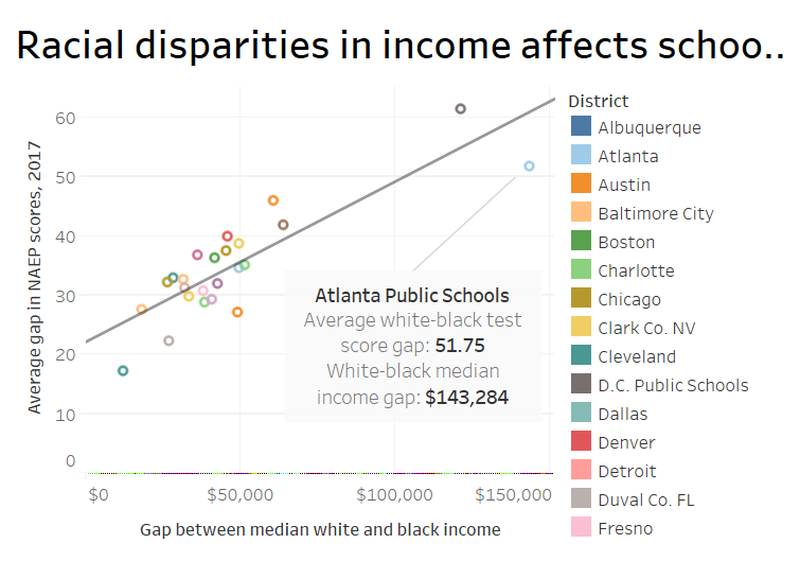
He was interested in the racial performance gaps measured by NAEP. This latest installment of the largest nationally representative assessment of America's students looked at math and reading in all 50 states and also in 27 large urban school districts, including Atlanta. It reported that the test score gap between black and white students in APS was second only to Washington, D.C.'s. But Apperson said in an email that the scores were only half the story: They were a function of an incredible income gap, he wrote, a gap that was unmatched in the country. He added what researchers have long known: Income correlates with test scores.
But the NAEP scores didn't come with income data attached; that context was absent because the U.S. education department doesn't collect it from all students. A phone call ensued, and Apperson revealed where he'd found his income information: Researchers at Stanford University compiled it using survey data from the U.S. Census Bureau. They were able to isolate the median household incomes, by race, of Atlanta's public school students. The numbers showed that the difference between blacks and whites in this city was, well, black and white.
“So the income gap is like $140,000, which is pretty crazy,” Apperson said on the phone. “There’s no other urban district that has a gap like that.” (For white students, the median household income was $167,087; for black students it was $23,803. Stanford’s data is about a decade old, but Apperson believes the income information is still representative of Atlanta.)
Washington, D.C. had the biggest test score gap and the second largest income gap at over $121,000. Baltimore and Cleveland, meanwhile, had among the smallest test score gaps and also the smallest income gaps, both under $20,000. The other cities had a similar relationship between income and test scores.
Apperson said his statistical analysis shows that income gaps in the big cities explain 74 percent of the variance in their NAEP test score gaps.
“The broader point is if you’re not considering these differences in income,” he said, “then you’re really just putting out these numbers that people take to mean something that they really don’t mean.” In other words, schools have an effect on test scores, but it’s comparatively small. Household income explains the rest. It buys trips to the museum and lines shelves with books. Parents with money, statistically speaking, also have college degrees and more knowledge to share with their children.
So what are the options? Do something about income inequality? Sure, but doesn’t education correlate with financial success? Which comes first?
Bit of a conundrum there.
Dana Rickman, executive vice president of the Georgia Partnership for Excellence in Education, is typically an unflappable data expert. But she had an enthusiastic reaction to Apperson's income-gap discovery: "Wow," she said. "That's a really big gap." She agreed that it shows a strong correlation between test scores and household income, something many people know intuitively to be true anyway. It is one reason, she said, that there was such a strong reaction against Gov. Nathan Deal's proposal to take over "chronically failing" schools. "You had a bunch of people saying it's basically a list of the schools with the most poverty." The data tell her that schools "really need to tend to the poor kids, because they're not getting the support they need."
So fewer tests or more accountability, more school choice or better screening for teachers? How can we choose a solution when we haven’t agreed on the problem?
Credit: Jennifer Peebles
Credit: Jennifer Peebles


